Floods, droughts — drought indices
This unit looks at extreme situations in the water cycle that are caused by too much or to few precipitation.

Goals
The goal of this unit is to introduce extreme events of the hydrological cycle and how they are classified.

After successful completion of this unit students will be able to
- Define floods, and droughts
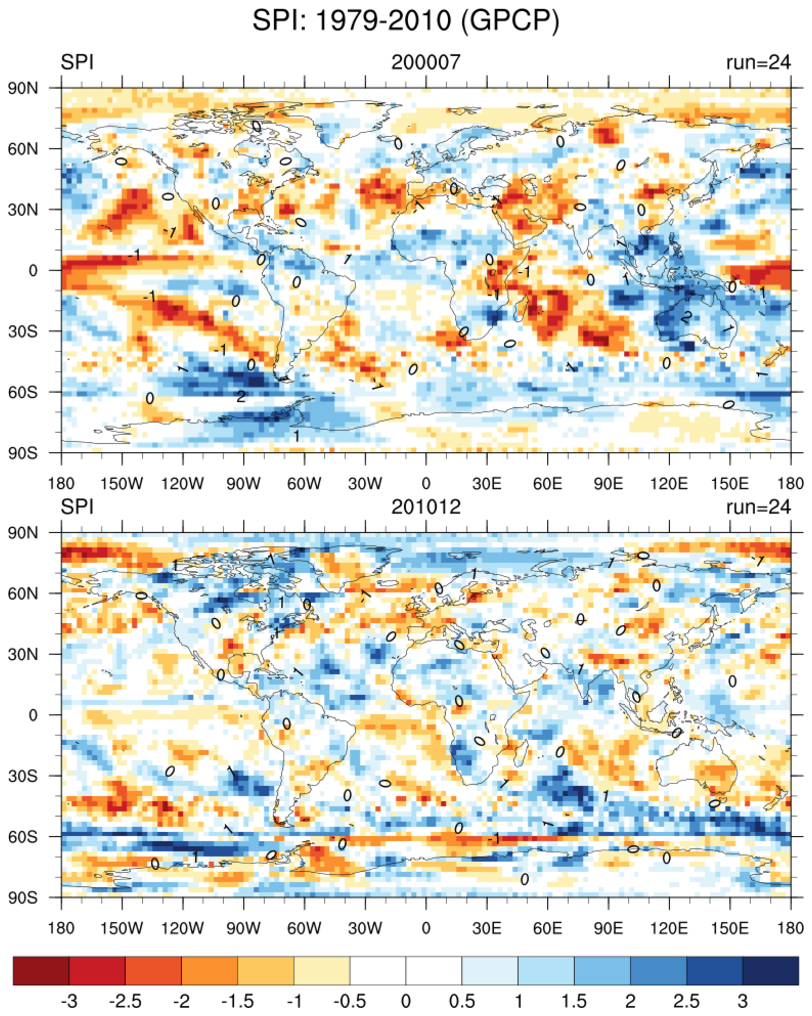
- Calculate, distinguish and evaluate various drought indices
- Calculate the 10, 50, 100, and 500 year flood likelihood using the percentile method
- Explain flood prediction
- Interpret river forecasts in terms of precipitation, evaporation, green (plant available) and blue (usable for mankind) terms (graduate students)

Students’ tasks
- Work thru this slide show
- Read this review article on drought indices
- Read Dingman C.9.2 Regional L-Moment Approach
- Take notes and prepare to present the material
- Fill out the questionnaire
- Compare drought indices, river forecasts, long-term river flood risk, and analysis of past droughts via this NOAA web site
- Undergraduate students: Post about something that you found interesting, didn’t expect or you just found “cool” when doing the comparison
- Graduate students: Write a small summary of what you learned from the comparison (< 1 page) and submit it by the deadline
Useful links and additional material
Standardized Precipitation Index data
Standardized Precipitation Evaporation Index data
Article by Haddad et al. 2012 on flood reoccurence comparison of flood frequency determination
Free software to calculate the SPI
Free software to calculate various drought indices
© 2021 Nicole Moelders | All Rights Reserved.
