Measurements and Quantitative Precipitation Estimates – QPE
This unit is about Quantitative Precipitation Estimates (QPE) from various observational tools. This unit explains how to quantify liquid and solid precipitation, which are a loss from the atmospheric part of the water cycle and an input for land including rivers and lakes, ocean and the glaciosphere paths of the water cycle.
After completion of this unit, students will be able to
- Assess errors in precipitation measurements under various atmospheric condition for various precipitation measurement devices
- Explain the uncertainty in precipitation measurements for various devices
- Identify the advantages and disadvantages of various measurements of precipitation
Students’ tasks
- Watch the videos
- Read Dingman’s book Chapter 4.2 to 4.2.3 (included)
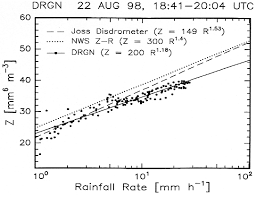
- Read this basic information on how to get a relationship between radar-reflectivity and -rain-rate (known as Z-R relation)
- Fill out the questionnaire
- Solve the task assigned at your class level in the Unit 4 Applications task sheet and submit the solutions by the deadline
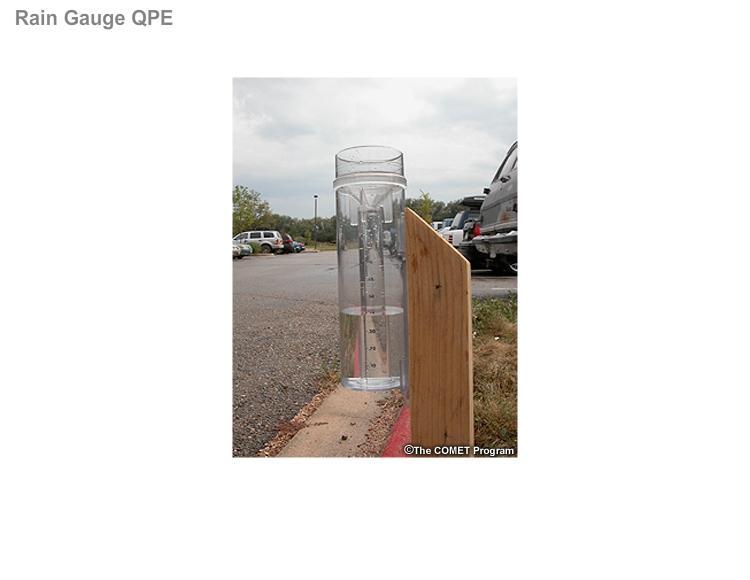
Point measurements
QPE from remote sensing
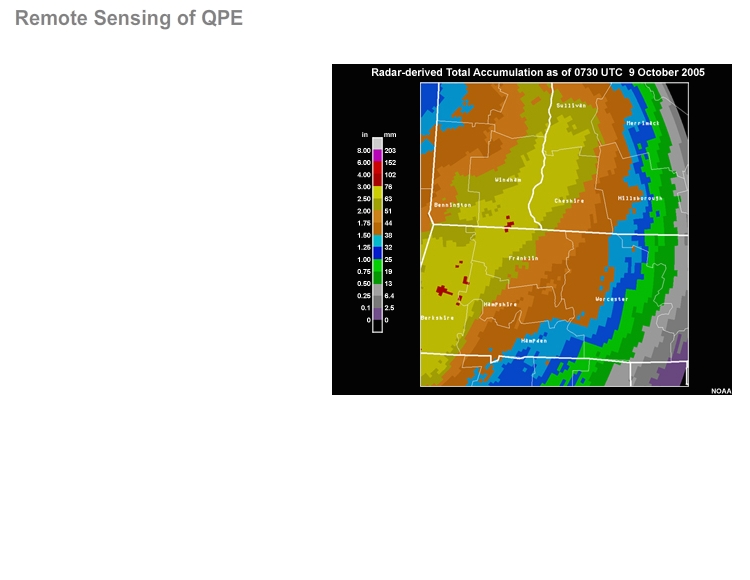
Radar QPE
Satellite QPE
Summary of QPE from remote sensing key points
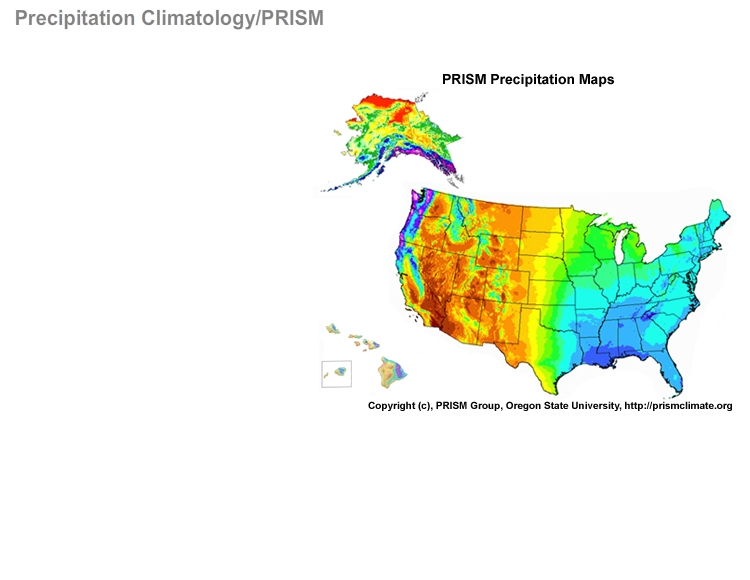
Areal estimation of precipitation climatology – example PRISM
Supplemental Material
From Houze, Cloud Dynamics, Z-R relationship explanation
FAQ
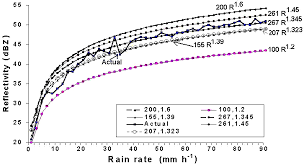
Q: The units in the Z-R relationships – Z=aRb look odd. How do I have to interpret them?
A: The a and b in the Z-R-relation are empirical constants, They are what the book calls broken units! Since Z is in mm6 m-3 and the rain rate R is in mm/h, the units of a must be mm6-b hb m-3. The reason is that the empirical Z-R relation is a fit rather than a description of the actual physical processes.
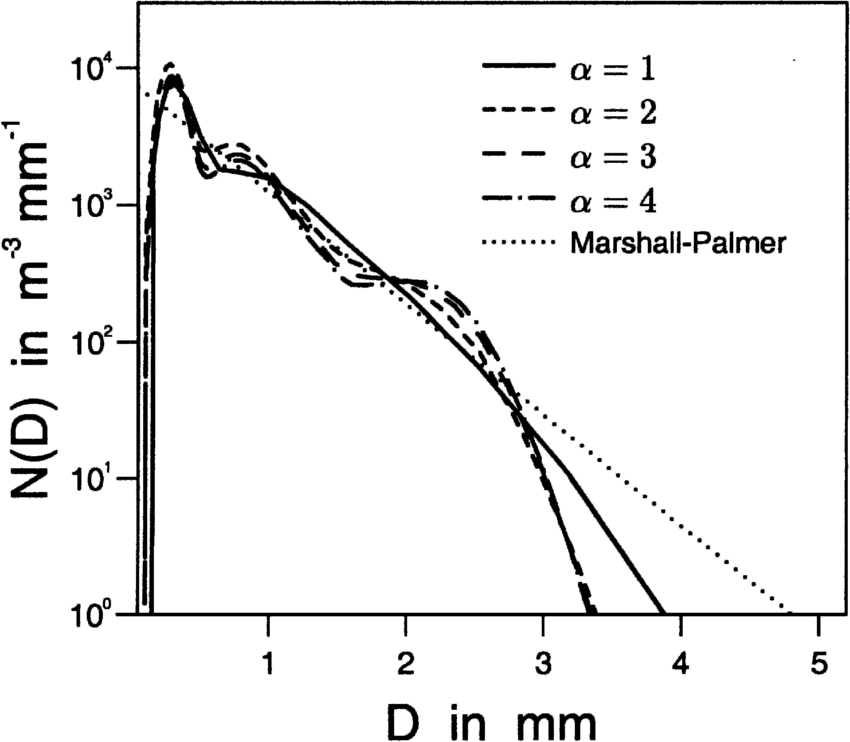
Q: What is the difference between monodisperse droplet distribution and the Marshall-Palmer and Austin distributions?
A: Monodisperse droplet distribution means all droplets have the same size. Marshall-Palmer and Austin distributions (diagrams below) are empirical distributions of the droplet sizes. Such (empirical) distribution are the underlying idea in the Z-R relationships. Any distribution assumes certain number of droplets of a given diameter. See also first diagram in this unit for examples of various droplet distributions.
Acknowledgements
The source of the movie material is the COMET ® Website at https://meted.ucar.edu/ of the University Corporation for Atmospheric Research (UCAR), sponsored in part through cooperative agreement(s) with the National Oceanic and Atmospheric Administration (NOAA), U.S. Department of Commerce (DOC) ©1997-2010 University Corporation for Atmospheric Research. All Rights Reserved.
© Nicole Mölders 2019