Areal estimations of precipitation from point measurements
This unit introduces various methods to derive areal precipitation distributions from point measurements. Such distributions are required for numerical weather prediction model evaluation, as input for hydrological models or when determined over 3 decades for determination of precipitation climatology.
The goal of this unit is to introduce various methods to establish spatial precipitation and their advantages and disadvantages
After completion of this unit students will be able to
- Identify the best method for a given data situation and terrain to calculate spatial precipitation estimates
- Create an areal precipitation estimate/distribution from point data
- Assess the errors in areal precipitation estimate/distribution
- Identify the advantages and disadvantages of various areal precipitation estimate/distribution methods
Students’ tasks
- Watch the videos listed under Thiessen polygon method and Application of areal estimation of precipitation – example PRISM climatology
- Read Dingman’s book Chapter 4.3 to 4.3.5 (included)
- Fill out the questionnaire
- Solve these Unit 5 Applications problems at your class level. Submit everything by Thursday 2359 Alaska Time.
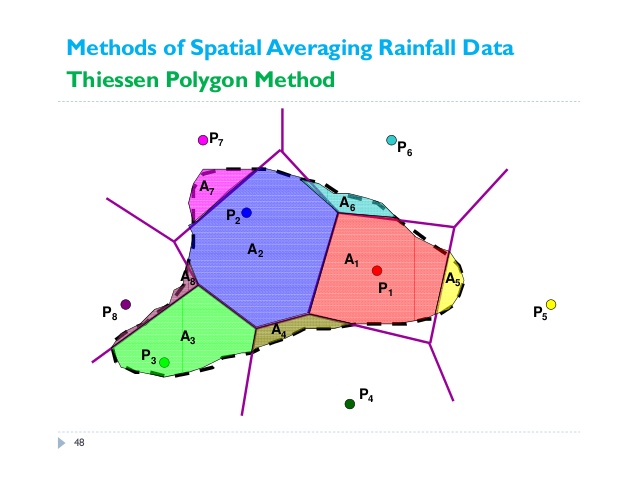
Thiessen polygon method
How to make areal precipitation estimate using the Thiessen polygon method.
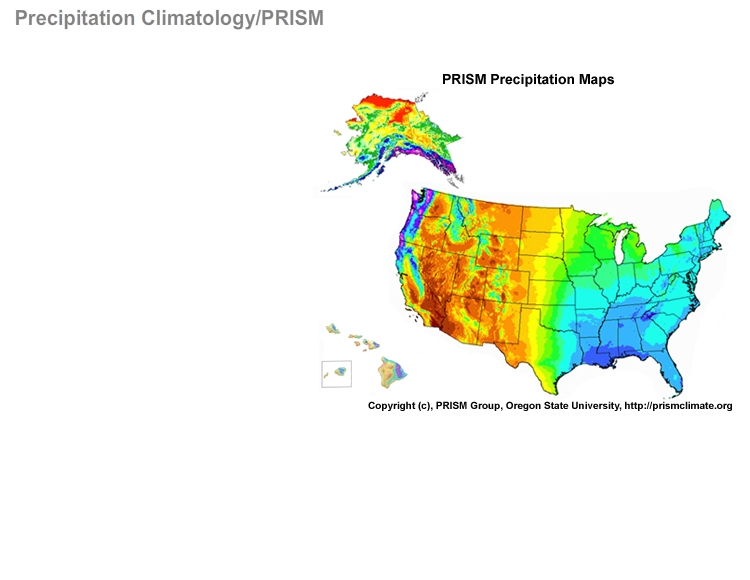
Application of areal estimation of precipitation – example PRISM climatology
FAQ
Q: I did assignment Task #2. I get different results for the different methods. What am I doing wrong?
A: As stated in Dingman, the different methods provide slightly different results. In orographic terrain, results among methods differ the strongest.
Q: In the above video on Thiessen polygons, why is station D connected to station A and not C? And similarly, why isn’t be connected to E and C? And so on?
A: Connections are made only between the sites with the shortest distances to each other. The idea is that the shorter a site is away from its boarders, the higher is the likelihood that it is representative for the area around it.
Q: I have a hard time understanding the isohytes method.
A: The isohytes method is based on the idea that precipitation increases with height because some of the clouds’ water load falls out as the clouds encounter a mountain barrier (recall the task on this in the Unit 3 applications). Recall the Unit 3 material and you can immediately pin-point a major disadvantage of this method. It treats the upwind and downwind side of the mountain the same. This means it will fail to consider from where the wind advects (,i.e. transports) the water laden air mass. Consequently, precipitation will be overestimate in the rain shadow side.
Supplemental Material (optional)
Thiessen Polygon Method
Step-by-step explanation of the Thiessen-Polygon method YouTube video
Doing a Thiessen Polygon Method with Esri ArcGIS 10
When on a job, you wouldn’t do the calculations by excel or calculator like in the homework assignment. Instead, you would use a software like GIS. This video gives an example how that works.
Acknowledgements
The source of the movie material is the COMET ® Website at https://meted.ucar.edu/ of the University Corporation for Atmospheric Research (UCAR), sponsored in part through cooperative agreement(s) with the National Oceanic and Atmospheric Administration (NOAA), U.S. Department of Commerce (DOC) ©1997-2010 University Corporation for Atmospheric Research. All Rights Reserved.
© Nicole Mölders | All rights reserved